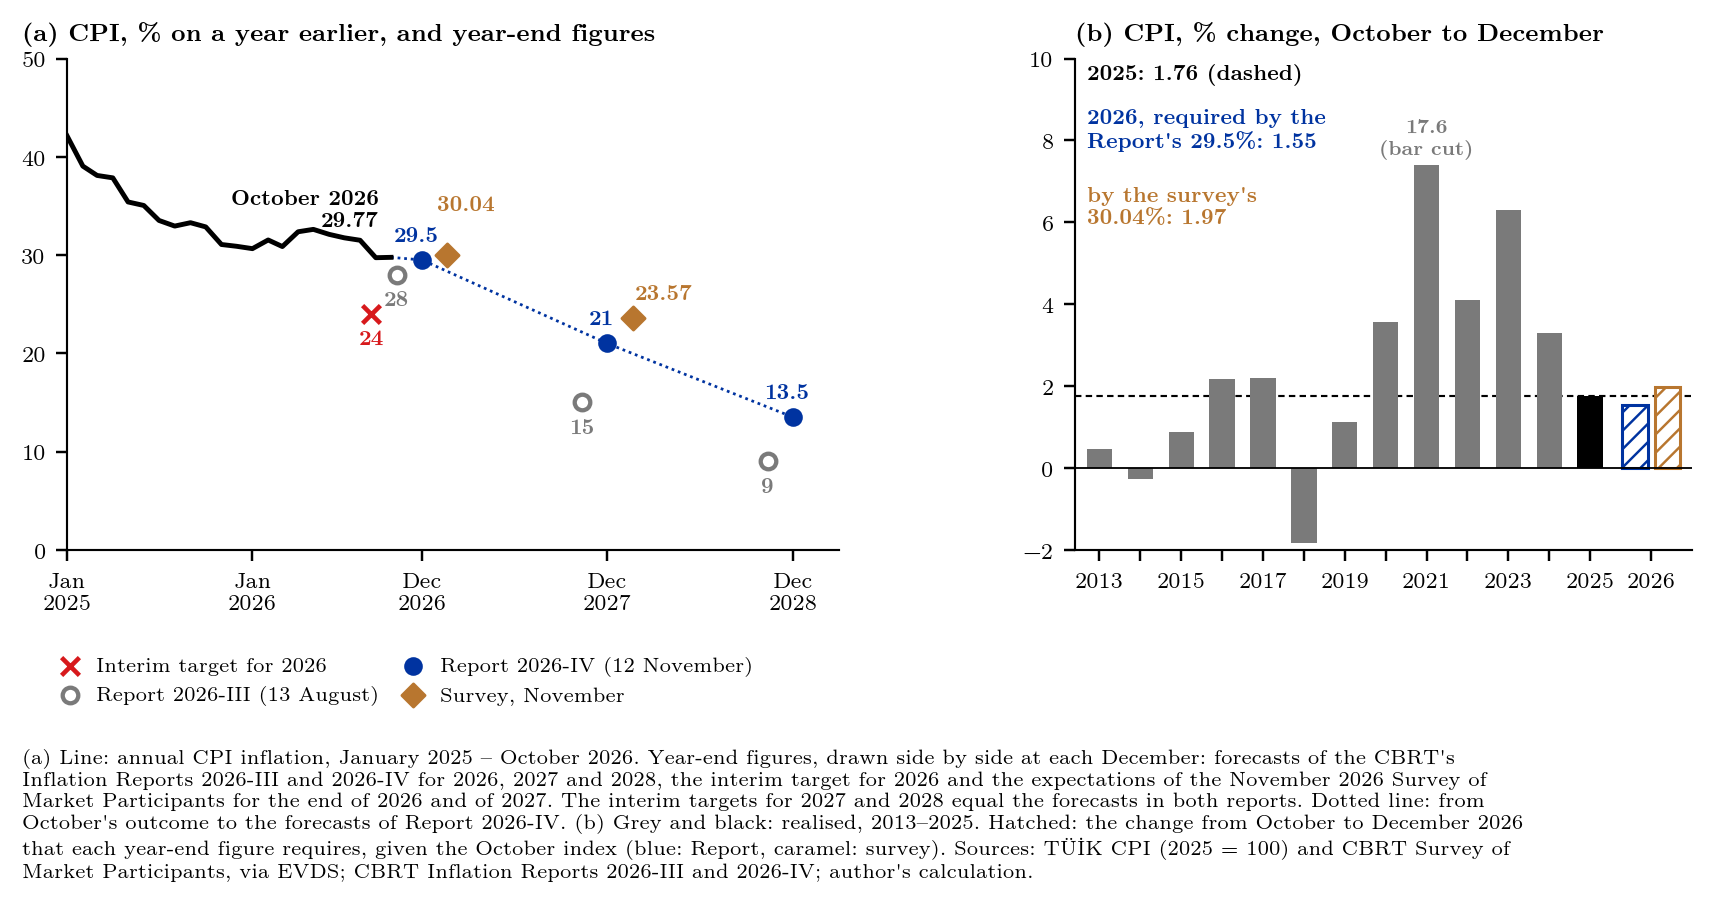
The Central Bank of the Republic of Türkiye (CBRT) published Inflation Report 2026-IV on 12 November. It forecasts consumer inflation of 29.5% at the end of 2026 and 21% at the end of 2027. The August report had 28% and 15% (CBRT, 2026a, 2026b).1 The interim target for 2026 stays at 24%, while those for 2027 and 2028 are raised from 15% to 21% and from 9% to 13.5%, which makes them equal to the forecasts, as they were in August. The Report attributes the revision mainly to import prices in lira: its assumption for the average oil price in 2026 rises from 87.8 to 97.2 dollars, and that for food inflation at the end of 2026 from 28.5% to 31.3%.
What a year-end figure requires can be computed from the index, as in the note on the October meeting summary (Yılmaz, 2026). Annual inflation was 29.77% in October. The Report's 29.5% implies that prices rise 1.55% between October and December. The 30.04% expected in the November Survey of Market Participants implies 1.97% (CBRT, 2026c).2 Prices rose 1.76% in the same two months of 2025, and the annual rate falls only if this year's increase is smaller. The Report is therefore below last year's figure and the survey above it (Figure 1b). The Report itself notes that inflation was low in November and December 2025 because of vegetable prices, and that base effects are expected to push annual inflation up in the rest of 2026. From 2013 to 2025 the October–December increase was below 1.55% in five of thirteen years. The 24% target would require prices to fall by 2.76%.
The survey moved less than October's outcome alone would suggest. Respondents had expected 2.11% for October, and prices rose 2.58%. With their October expectations for November and December, 1.18% and 0.97%, the year-end rate would be 30.28%. They lowered them to 1.09% and 0.84%, which compound to 1.94% and a year-end rate of 30.00%, close to the 30.04% they report directly.
For the end of 2027 the survey expects 23.57%, against the Report's 21% (Figure 1a). In August, when the target for 2027 was 15%, the survey already expected 21.94%. Twelve and twenty-four months ahead it expects 24.04% and 18.02%.
How close has the November expectation been in the past? From 2013 to 2025 it was within 1 point of the year-end outcome in 5 of 13 years, with a median absolute difference of 1.24 points. In each of the last four years inflation ended below it, by 0.43 to 3.79 points. These are descriptive comparisons, not a forecast.3
References
Central Bank of the Republic of Türkiye. (2026a, November 12). Enflasyon Raporu 2026-IV (in Turkish; English title: Inflation Report 2026-IV). https://www.tcmb.gov.tr/wps/wcm/connect/tr/tcmb+tr/main+menu/yayinlar/raporlar/enflasyon+raporu/2026/enflasyon+raporu+2026+-+iv
Central Bank of the Republic of Türkiye. (2026b, August 13). Inflation Report 2026-III. https://www.tcmb.gov.tr/wps/wcm/connect/EN/TCMB+EN/Main+Menu/Publications/Reports/Inflation+Report/2026/Inflation+Report+2026+-+III
Central Bank of the Republic of Türkiye. (2026c). Electronic Data Delivery System (EVDS) (data set): series TP.TUKFIY2025.GENEL and TP.PKAUO.S01.A.U, B.U, C.U, D.U, E.U, F.U and I.U. Retrieved November 14, 2026, from https://evds3.tcmb.gov.tr
Yılmaz, M. İ. (2026, October 31). CBRT meeting summary, October 2026: Food accounts for four-fifths of September's fall in inflation, and the survey implies 4.3% from September to December. https://muhammedikbalyilmaz.com/posts/cbrt-mpc-summary-october-2026.html
Notes
-
Report 2026-IV was read in its Turkish full text (CBRT, 2026a): the forecasts, the interim targets, the reasons for the revision and the remark on base effects are in section 3.2, and the assumptions in Table 3.1.2. The forecasts were also compared with the English Overview of the same report. The August forecasts and targets are from the Overview of Report 2026-III (CBRT, 2026b). The English title of the Turkish report is the CBRT's own. Figures taken from the two reports: reports (CSV). ↑
-
Data are from the CBRT's Electronic Data Delivery System (CBRT, 2026c), retrieved 14 November 2026: TP.TUKFIY2025.GENEL (TÜİK CPI, 2025 = 100, December 2012 – October 2026), CPI (CSV). From the Survey of Market Participants, published on 13 November: TP.PKAUO.S01.D.U (year-end expectation, January 2013 – November 2026) and, for 2026, S01.A.U, B.U and C.U (monthly expectations for the survey month and the next two months), E.U and F.U (12 and 24 months ahead) and I.U (end of the next year), survey (CSV). The workbook lists every number in the note next to the formula that produces it and a check against the text, so that readers who wish to examine the calculations can follow and audit them in a spreadsheet without losing time and without running any code. The code that draws the figure and repeats the same calculations is available on request. ↑
-
Calculations (author's). $P_t$ is the CPI in month $t$ and $\pi$ a year-end annual rate (as a fraction). The December 2026 index that $\pi$ implies, and the change it requires from October: $$P^{\ast}_{\text{Dec 2026}} = P_{\text{Dec 2025}}\,(1 + \pi)$$ $$g = \left(\frac{P^{\ast}_{\text{Dec 2026}}}{P_{\text{Oct 2026}}} - 1\right)\times 100$$ Report, $\pi = 0.295$: $$110.386963 \times 1.295 = 142.951, \qquad g = \left(\frac{142.951}{140.77} - 1\right)\times 100 = 1.55$$ Survey, $\pi = 0.3004$: $$110.386963 \times 1.3004 = 143.547, \qquad g = \left(\frac{143.547}{140.77} - 1\right)\times 100 = 1.97$$ Interim target, $\pi = 0.24$: $$g = \left(\frac{110.386963 \times 1.24}{140.77} - 1\right)\times 100 = -2.76$$ The same two months of 2025: $$\left(\frac{110.386963}{108.477581} - 1\right)\times 100 = 1.76$$ The October–December change was below 1.55% in 2013, 2014, 2015, 2018 and 2019. Year-end rate with October's outcome and the October survey's expectations for November and December: $$\left(\frac{140.77 \times 1.0118 \times 1.0097}{110.386963} - 1\right)\times 100 = 30.28$$ November survey's expectations, compounded, and the year-end rate they give: $$(1.0109 \times 1.0084 - 1)\times 100 = 1.94, \qquad \left(\frac{140.77 \times 1.0194}{110.386963} - 1\right)\times 100 = 30.00$$ Survey accuracy. For each year $y$ from 2013 to 2025, with $\pi_y$ the December annual rate and $E_y$ the November expectation for the end of year $y$: $$d_y = \pi_y - E_y$$ Five of the 13 values of $|d_y|$ are 1 point or less and their median is 1.24 points. For 2022–2025, $d_y$ is $-3.79$, $-2.46$, $-0.43$ and $-1.31$. ↑