The National Bureau of Statistics of China (NBS) published its October price figures on 9 November 2026. Consumer prices were 0.7% higher than a year earlier (NBS, 2026a), after 0.9% in September (NBS, 2026d), and unchanged on the month. Producer prices for industrial products were 5.7% higher than a year earlier and 0.7% higher on the month (NBS, 2026b), after 5.0% and 1.2% in September (NBS, 2026c).1 The PPI reading is the highest of the 37 months in Figure 1a, and the gap between it and the CPI rate, 5.0 percentage points (note 3), is the largest; the PPI has been above the CPI in every month since April 2026. These comparisons cover only the 37 months from October 2023 to October 2026 collected for this note; months before October 2023 were not examined, so they are not statements about the longer history of either index. The CPI rate peaked at 1.3% in February 2026 (NBS monthly releases, note 2). The PPI measures the prices at which industrial enterprises first sell their products; NBS also publishes the prices industrial producers pay for their inputs, which rose 7.9% on the year in October (NBS, 2026b), after 6.9% in September (NBS, 2026c).2
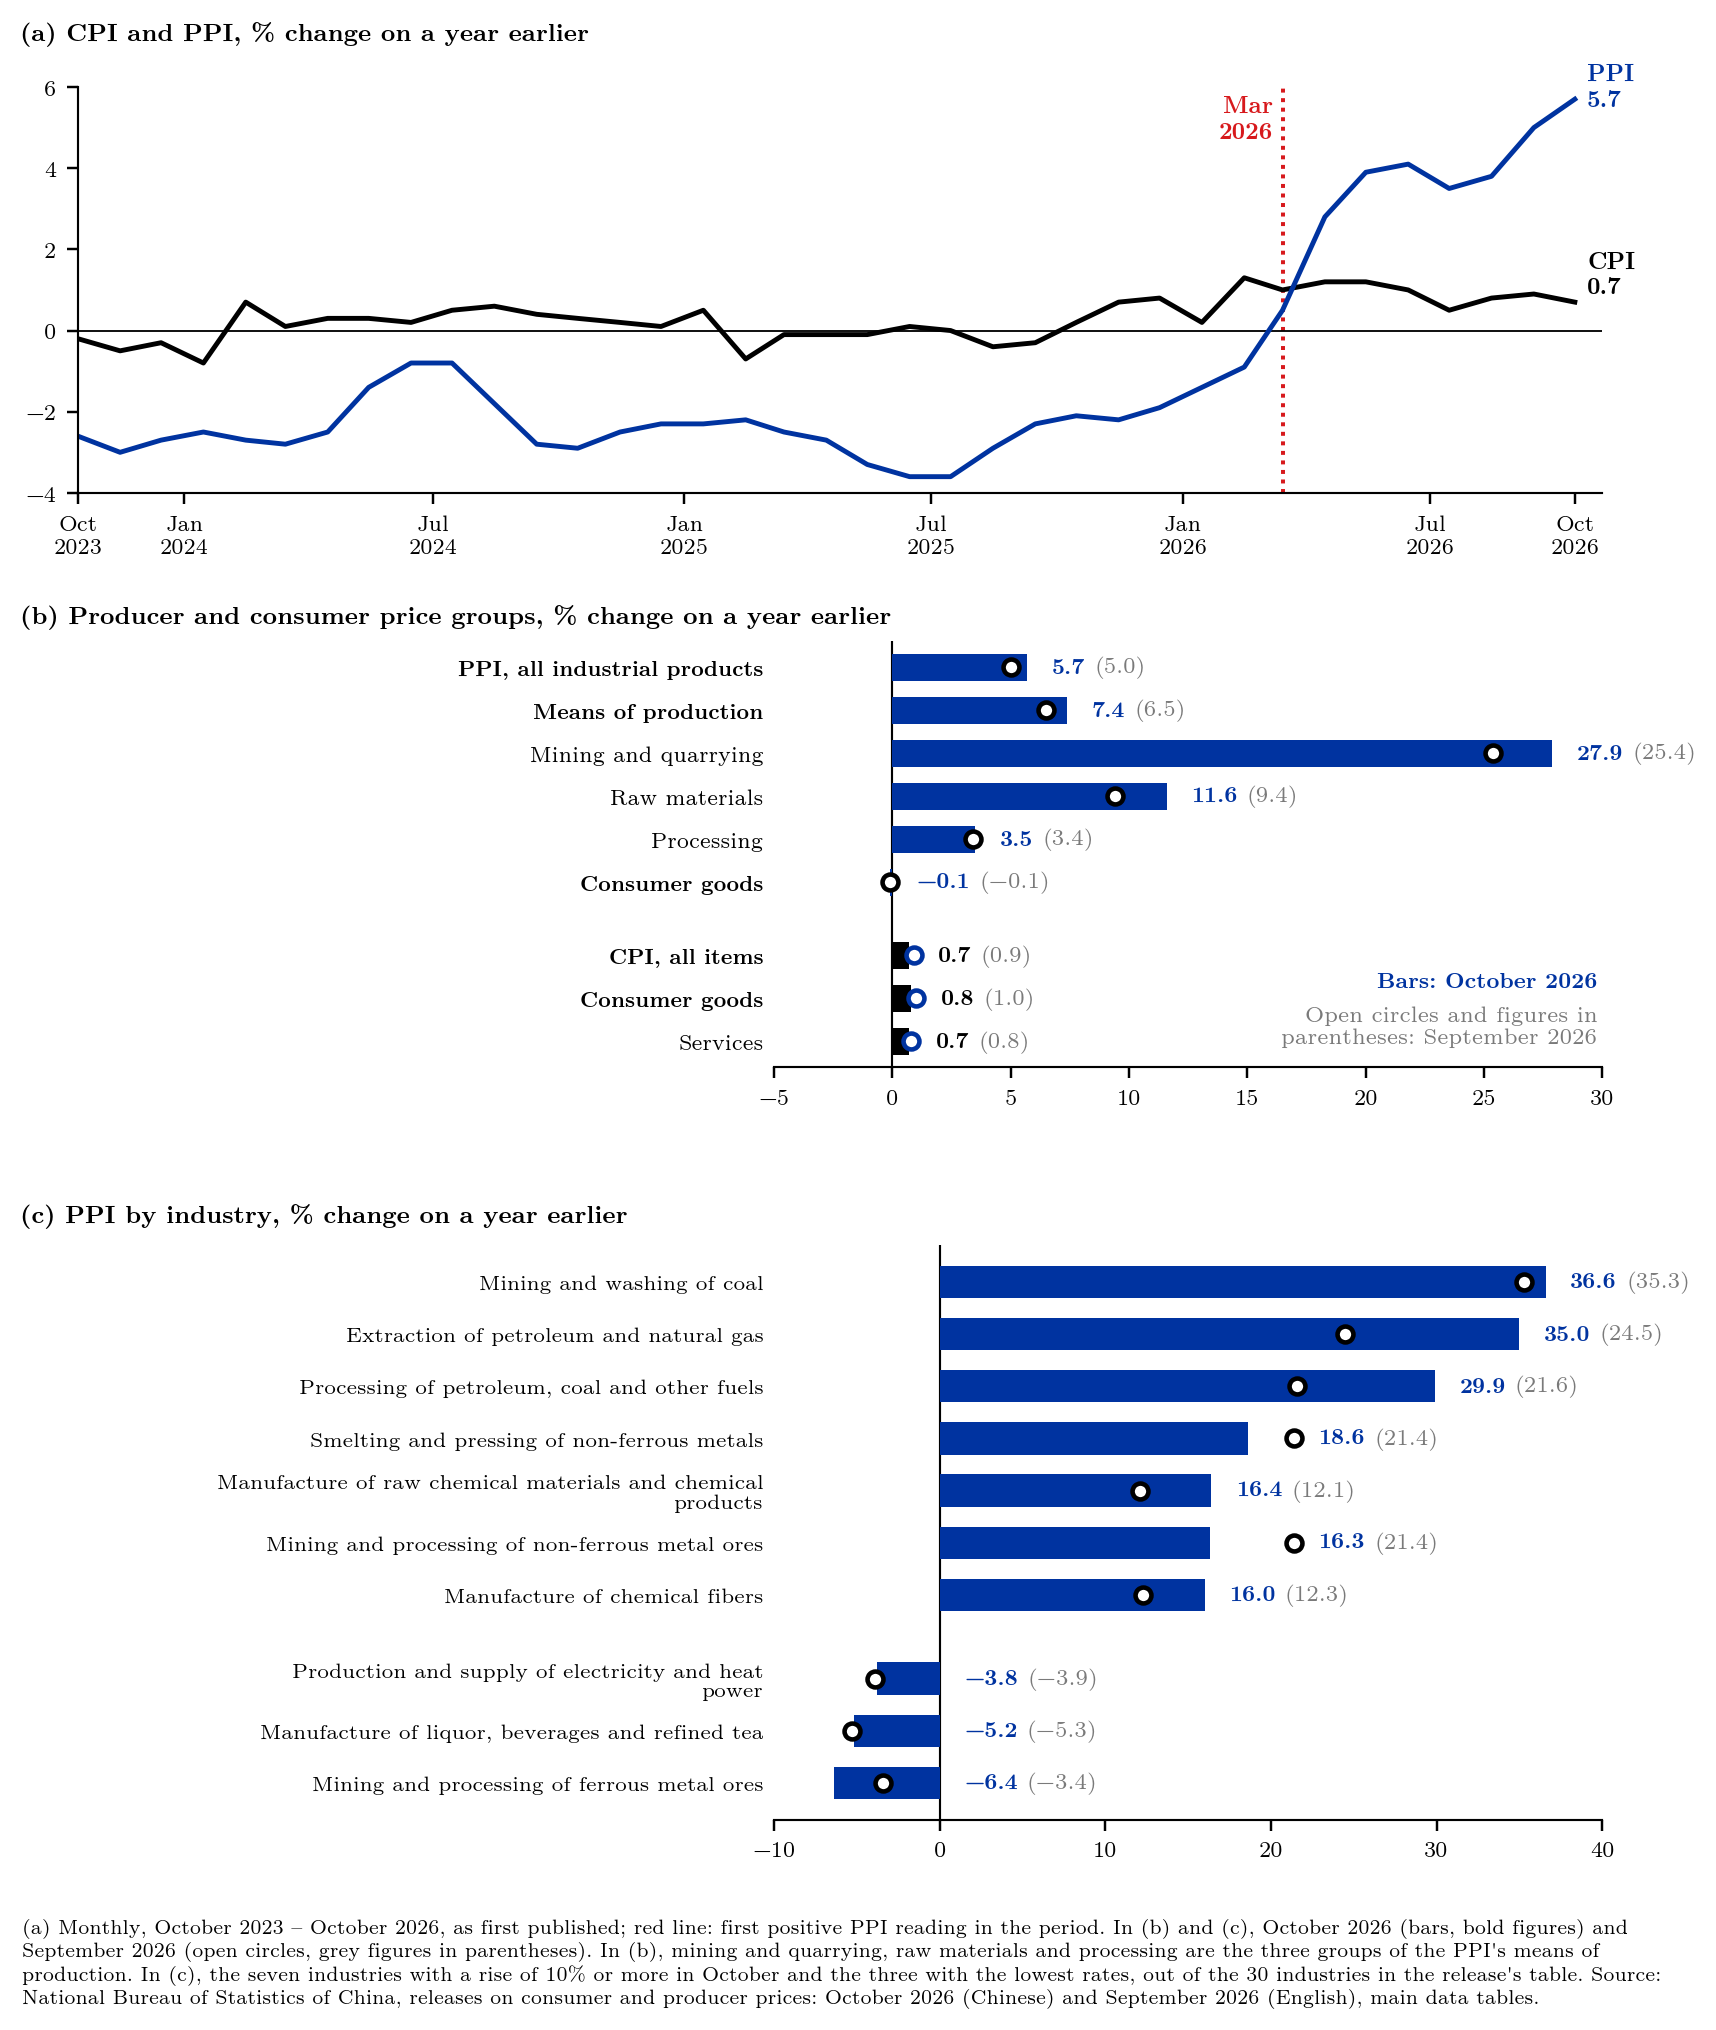
In the PPI, the increase is at the upstream end. Prices of means of production were 7.4% higher on the year, with mining and quarrying at 27.9%, raw materials at 11.6% and processing at 3.5%, while prices of consumer goods were 0.1% lower (NBS, 2026b; Figure 1b). NBS states that means of production added about 5.77 points to the PPI rate and consumer goods subtracted about 0.03, which sum to 5.74, in line with the published 5.7 (NBS, 2026b).3 In September the same groups were at 6.5% (means of production), 25.4% (mining and quarrying) and −0.1% (consumer goods) (NBS, 2026c; Yılmaz, 2026a). In the CPI, consumer goods prices were 0.8% higher than a year earlier and services prices 0.7% (NBS, 2026a). This note describes the published rates and does not estimate how much of the producer price increase passes into consumer prices.
Of the 30 industries in the release's table, 15 had a positive annual rate and 15 a negative one, and seven were 10% or more above a year earlier (NBS, 2026b), as shown in Figure 1c: mining and washing of coal (36.6%), extraction of petroleum and natural gas (35.0%), processing of petroleum, coal and other fuels (29.9%), smelting and pressing of non-ferrous metals (18.6%), manufacture of raw chemical materials and chemical products (16.4%), mining and processing of non-ferrous metal ores (16.3%) and manufacture of chemical fibers (16.0%). The first three were at 35.3%, 24.5% and 21.6% in September, while the two non-ferrous metal industries were at 21.4% each (NBS, 2026c). Mining and processing of ferrous metal ores had the lowest rate in October, −6.4%, after −3.4% in September (NBS, 2026b, 2026c). Among input prices, fuel and power rose 18.6% (13.6% in September), raw chemical materials 16.8% and nonferrous metals and cables 16.7%, while building materials and non-metals fell 1.9% and ferrous metals 1.1% (NBS, 2026b, 2026c). The releases do not discuss the reasons for these changes.
On the consumer side, food prices were 2.9% lower than a year earlier (fresh vegetables −16.9%, pork −8.6%) and non-food prices 1.5% higher; the CPI excluding food and energy rose 0.8%, after 1.0% in September (NBS, 2026a, 2026d). Energy for transport facilities was 20.2% higher on the year, after 14.9% in September, and 3.8% higher on the month (NBS, 2026a, 2026d). NBS reports that the food, tobacco, liquor and dining-out group lowered the CPI rate by about 0.48 points, of which fresh vegetables accounted for about 0.31 (NBS, 2026a). NBS publishes the October industrial profits on 27 November (NBS, 2025).
References
National Bureau of Statistics of China. (2025, December 26). Regular Press Release Calendar of NBS in 2026. https://www.stats.gov.cn/english/PressRelease/ReleaseCalendar/202512/t20251226_1962154.html
National Bureau of Statistics of China. (2026a, November 9). 2026年10月份居民消费价格同比上涨0.7% (in Chinese; English title: Consumer prices in October 2026 rose 0.7% year on year). https://www.stats.gov.cn/sj/zxfb/202611/t20261109_1965795.html
National Bureau of Statistics of China. (2026b, November 9). 2026年10月份工业生产者出厂价格同比上涨5.7% 环比上涨0.7% (in Chinese; English title: Producer prices for industrial products in October 2026 rose 5.7% year on year and 0.7% month on month). https://www.stats.gov.cn/sj/zxfb/202611/t20261109_1965794.html
National Bureau of Statistics of China. (2026c, October 15). Industrial Producer Price Indexes in September 2026. https://www.stats.gov.cn/english/PressRelease/202610/t20261015_1965499.html
National Bureau of Statistics of China. (2026d, October 15). Consumer Price Index in September 2026. https://www.stats.gov.cn/english/PressRelease/202610/t20261015_1965500.html
Yılmaz, M. İ. (2026a, October 14). China's consumer and producer prices, September 2026: producer price inflation rises to 5.0%. https://muhammedikbalyilmaz.com/posts/china-cpi-ppi-september-2026.html
Notes
-
Both October releases carry the time stamp 9 November 2026, 09:30, and the NBS release calendar lists the monthly reports on the consumer price index and on the industrial producer price index for 9 November at 9:30 (the calendar states no time zone, and NBS describes its dates as preliminary) (NBS, 2025). The October figures are taken from the Chinese releases, text and main data tables; the English versions had not been posted when this note was written. The English names of industries, groups and categories are those used in NBS's English releases for September 2026 (NBS, 2026c, 2026d); the Chinese names are in the data files. The English titles of the two Chinese releases in the reference list were translated from Chinese with DeepL; the Chinese titles are given as published. Both October releases note that the indexes have been compiled on a 2025 base since January 2026, a change that NBS estimates moved the monthly year-on-year rates by about 0.06 percentage points for the CPI and 0.08 for the PPI on average. ↑
-
Monthly year-on-year rates, October 2023 – October 2026, as first published in each NBS release: data (CSV, with the release link for every month). Main data tables of the October 2026 releases: producer prices (CSV) and consumer prices (CSV); the same tables from the English September 2026 releases: producer prices (CSV) and consumer prices (CSV). The workbook lists every number in the note next to the formula that produces it and a check against the text, so that readers who wish to examine the calculations can follow and audit them in a spreadsheet without losing time and without running any code. The code that draws the figure and repeats the same calculations is available on request. ↑
-
Definitions. Year-on-year and month-on-month rates, where $P$ is the price index: $$\pi_t = \left(\frac{P_t}{P_{t-12}} - 1\right) \times 100, \qquad \left(\frac{P_t}{P_{t-1}} - 1\right) \times 100$$ A group's contribution to the total, which NBS reports in percentage points, is approximately the group's weight in the index multiplied by the group's own price change. The gap is $g_t = \pi^{PPI}_t - \pi^{CPI}_t$, the difference of the two published rates rounded to one decimal. Calculations (author's). "The highest of the 37 months" means $\pi^{PPI}_t \le 5.7$ for every month $t$ from October 2023 to October 2026, with equality only in October 2026. The gap in October 2026 and in September: $$g = 5.7 - 0.7 = 5.0, \qquad 5.0 - 0.9 = 4.1$$ $g_t > 0$ in each month from April to October 2026 and $g = -0.5$ in March. The two contributions NBS states for the PPI, which round to the published 5.7: $$5.77 + (-0.03) = 5.74$$ The counts of industries refer to the 30 industries in the main data table of the PPI release; the survey covers 41 industry groups (NBS, 2026b, note 2). ↑