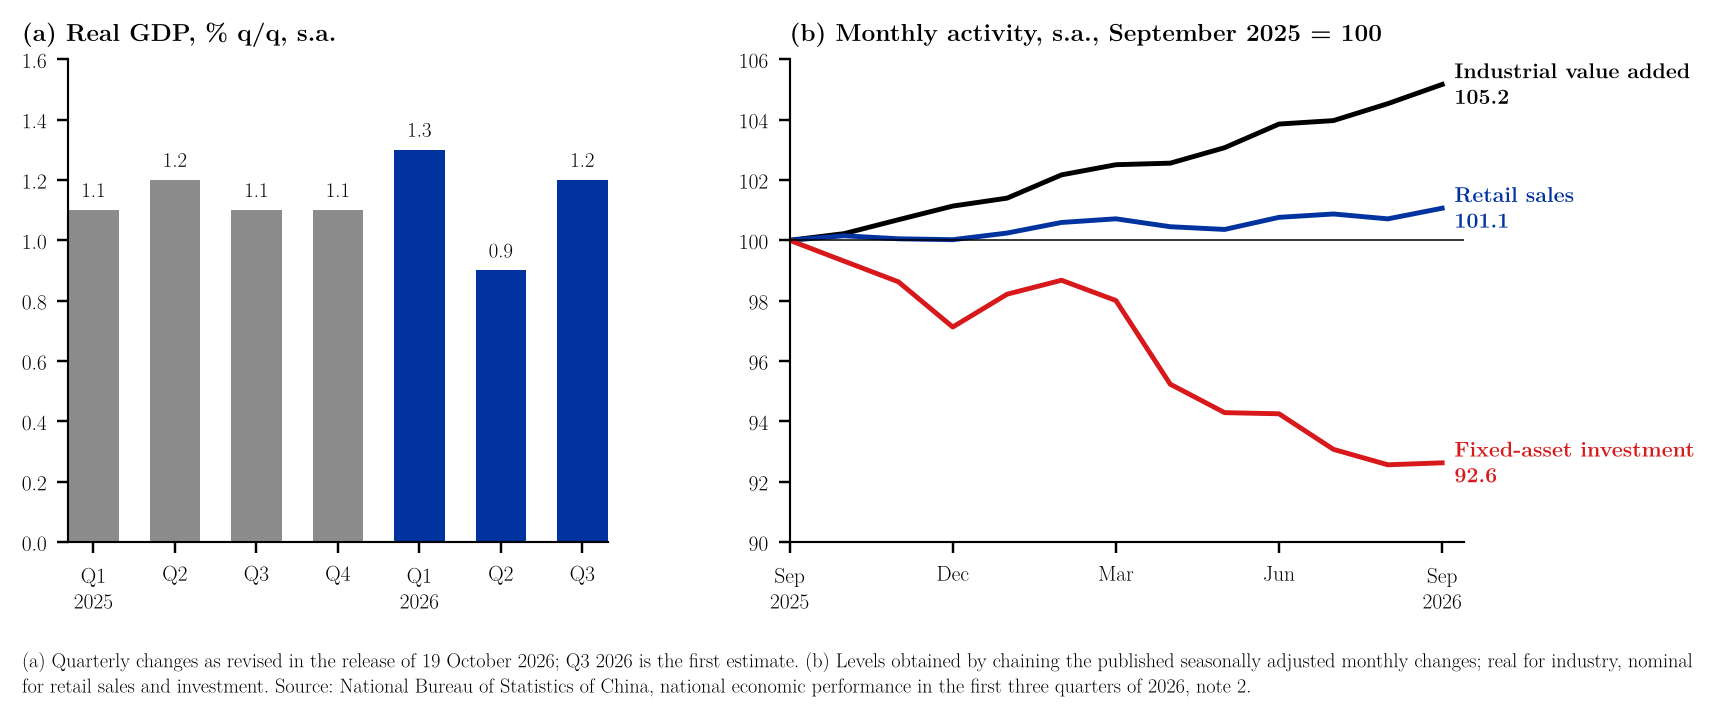
The National Bureau of Statistics of China (NBS) estimates that real GDP grew 4.5% year on year in the third quarter of 2026, after 5.0% in the first quarter and 4.3% in the second, and 4.6% in January–September as a whole (NBS, 2026).1 On the previous quarter, after seasonal adjustment, growth was 1.2%, up from 0.9% in the second quarter (NBS, 2026, note 2); at an annual rate that is 4.9% (Figure 1a; note 3). The two measures fit together: the four latest quarterly changes, Q4 2025 to Q3 2026, compound to 4.6%, close to the 4.5% year-on-year figure (NBS, 2026; note 3). By sector, value added rose 3.7% in the primary, 3.8% in the secondary and 5.2% in the tertiary sector in January–September (NBS, 2026). In September, industrial value added was up 5.5% on the year and retail sales of consumer goods 1.1%; the surveyed urban unemployment rate fell 0.1 point to 5.2% (NBS, 2026). Prices moved in two directions: consumer prices were 0.9% higher than a year earlier in September, producer prices 5.0% higher (NBS, 2026).
The monthly data show activity going in different directions within the year. NBS publishes seasonally adjusted month-on-month changes for three indicators, revised in this release (NBS, 2026, note 2), and chaining them gives a level for each (Figure 1b; note 3). Since September 2025, industrial value added is up 5.2%, retail sales 1.1% and fixed-asset investment is down 7.4%; on quarterly averages of these levels, industry rose 1.35% in the third quarter on the second, retail sales 0.36% and investment fell 1.94% (note 3). Industry is measured in real terms here, while retail sales and investment are nominal (NBS, 2026, note 1). In the year-to-date figures, fixed-asset investment was 7.2% lower in January–September than a year earlier, the same rate as in January–August; excluding property development the decline was 4.2%, while property development investment fell 20.6%, infrastructure 4.2%, manufacturing 2.1% and private investment 10.4% (NBS, 2026). Investment in intellectual property products rose 9.3% (NBS, 2026). Exports of goods were 16.4% higher in January–September and 29.6% higher in September alone (NBS, 2026). Per capita disposable income rose 5.3% in nominal and 4.4% in real terms in January–September (NBS, 2026). The release says that the seasonal adjustment model revised the past year's monthly figures (NBS, 2026, note 2). The data are in note 2 and the arithmetic in note 3.23
References
National Bureau of Statistics of China. (2026, October 19). 前三季度经济运行总体平稳 高质量发展取得新成效 (in Chinese; English title: The national economy was generally stable in the first three quarters, with new progress in high-quality development). https://www.stats.gov.cn/sj/zxfb/202610/t20261019_1965618.html
Notes
-
The figures are taken from the text and tables of the Chinese release of 19 October 2026 (NBS, 2026). The English titles of the Chinese releases in the reference list were translated from Chinese with DeepL; the Chinese titles are given as published. Note 1 of the release: GDP is at constant prices and industrial value added at comparable prices (real growth); other indicators are at current prices (nominal growth) unless stated otherwise. Note 2 gives the revised quarterly and monthly seasonally adjusted changes. ↑
-
Quarterly GDP growth on the previous quarter (seasonally adjusted) for Q1 2025 – Q3 2026, year-on-year GDP growth for Q1–Q3 2026, and the seasonally adjusted monthly changes of industrial value added, fixed-asset investment (excluding rural households) and retail sales of consumer goods for September 2025 – September 2026, all from the release above: data (CSV). The workbook lists every number in the note next to the formula that produces it and a check against the text, so that readers who wish to examine the calculations can follow and audit them in a spreadsheet without losing time and without running any code. The code that draws the figure and repeats the same calculations is available on request. ↑
-
Calculations. Annualised quarterly growth: $$(1.012^4 - 1) \times 100 = 4.89$$ Compounding the last four quarterly changes: $$(1.011 \times 1.013 \times 1.009 \times 1.012 - 1) \times 100 = 4.58$$ This compares with 4.5% year on year; the two need not coincide, because the year-on-year rate compares the quarter directly with the same quarter of 2025 instead of chaining seasonally adjusted changes, and both are rounded to one decimal. Levels in Figure 1b, where $g_t$ is the published monthly change for October 2025 to September 2026: $$L_{\text{Sep 2025}} = 100, \qquad L_t = L_{t-1}\left(1 + \frac{g_t}{100}\right)$$ This gives $L_{\text{Sep 2026}} = 105.17$ for industry, $101.06$ for retail sales and $92.62$ for investment. Quarterly change on quarterly averages, with $\bar L_{Q}$ the mean of the three monthly levels: $$\frac{\bar L_{Q3}}{\bar L_{Q2}} - 1$$ The results are $1.35\%$, $0.36\%$ and $-1.94\%$. The monthly changes are published to two decimals, so these levels carry a small rounding error. The twelve-month change of the chained industry level, 5.2%, differs from the September year-on-year rate of 5.5%; the latter compares September directly with September 2025 and, according to note 3 of the release, uses a set of enterprises kept as consistent as possible with that of the previous year, so the two are not expected to match. ↑