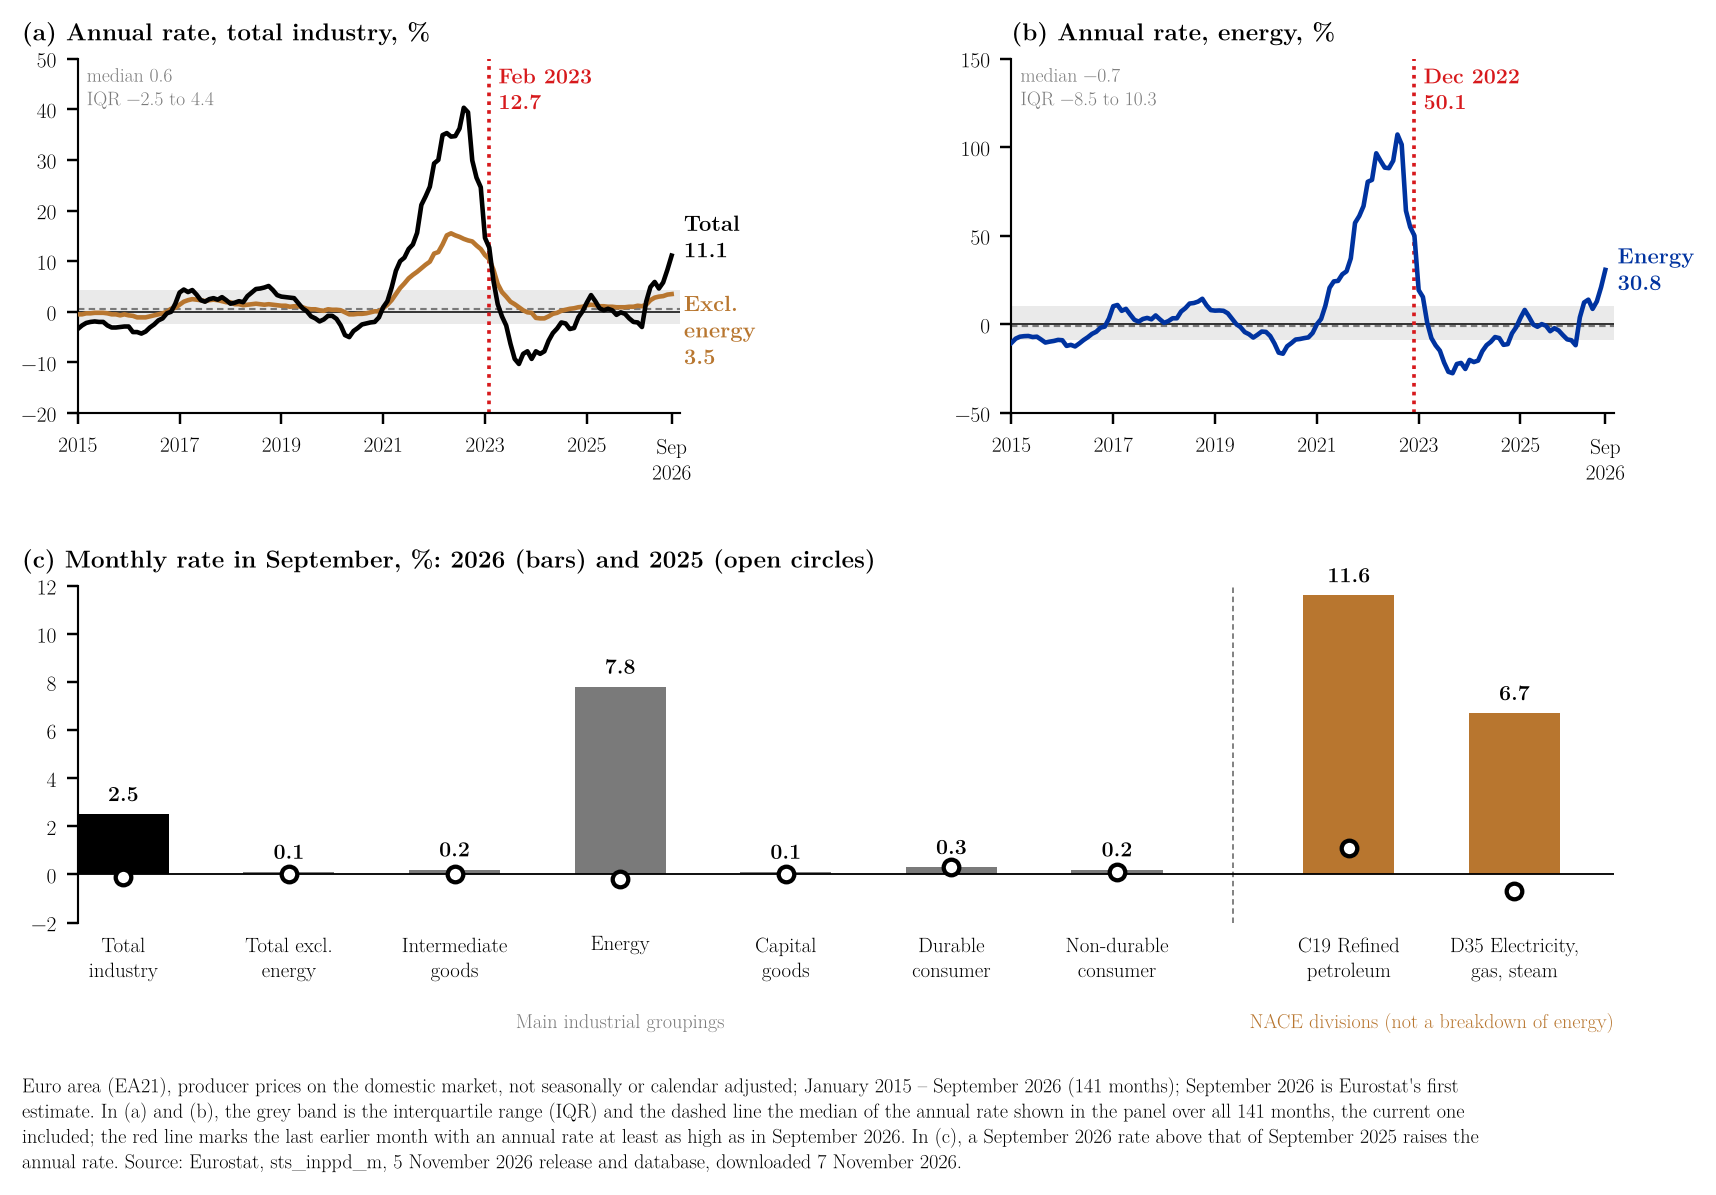
Eurostat reported on 5 November that industrial producer prices on the domestic market rose by 2.5% in the euro area in September 2026, after 2.0% in August, and were 11.1% higher than a year earlier, against 8.3% in August (Eurostat, 2026a).1 This is the highest annual rate since February 2023 (12.7%). Energy prices rose 7.8% on the month and 30.8% on the year, the highest annual rate since December 2022 (50.1%). Excluding energy, prices rose 0.1% on the month and 3.5% on the year. Among the other groupings, intermediate goods were 7.1% higher than a year earlier, capital goods 2.7% and durable consumer goods 3.4%, while non-durable consumer goods were 0.6% lower.
The annual rate rose because this September's monthly rate was far above last September's, when prices fell by 0.1%. The base-effect identity used in the note on euro area flash inflation (Yılmaz, 2026b) reproduces it: $(1.083 \times 1.025 / 0.999 - 1) \times 100 = 11.1$. For energy it gives 30.7% against the published 30.8%, because the monthly rates are rounded to one decimal (note 3). Energy prices rose in each of the last three months (5.8%, 5.6% and 7.8%) after falling from April to June, and 7.8% is their largest monthly rise since March 2026 (11.0%). Figure 1c also shows two NACE divisions from the database, refined petroleum products (11.6% on the month) and electricity, gas, steam and air conditioning supply (6.7%); they are shown next to the groupings, not added up to them.2
To place the level, over January 2015 – September 2026 (141 months) the median annual rate of total industry is 0.6%, with an interquartile range of −2.5% to 4.4%, and 11.1% is above 120 of the other 140 months. The mean, 3.6%, is well above the median because of 2021–23, which is why the grey bands in Figure 1 are medians and interquartile ranges. For energy the median is −0.7% (interquartile range −8.5% to 10.3%) and 30.8% is above 124 of the other 140 months (Figure 1a, b). Annual rates in consecutive months share eleven of their twelve months, so the 141 observations are not independent; the counts describe where the rate stands in the published series and are not probabilities.3
In that note the harmonised index of consumer prices (HICP) was 3.8% on the year in September, with energy at 18.9% (Yılmaz, 2026b). The two measure different things, ex-works prices of domestic industrial output against consumer prices that include taxes, distribution margins and services, so this note does not estimate how one passes into the other. The Bank of Japan's minutes, summarised in another note (Yılmaz, 2026a), describe a similar ordering in Japan, with producer price inflation of 7–8% and consumer price inflation of 1.5–2.0% after crude oil prices rose rapidly from the end of February (Bank of Japan, 2026, p. 6).
These are first estimates, and the next release is on 3 December. The index covers the domestic market only, excluding imports, and is not adjusted for seasonal or calendar effects, so monthly rates include seasonal movements. The release does not give the weights of the groupings, so the 2.5% is not split into contributions here.
References
Bank of Japan. (2026, November 5). Minutes of the Monetary Policy Meeting on September 17 and 18, 2026. https://www.boj.or.jp/en/mopo/mpmsche_minu/minu_2026/g260918.pdf
Eurostat. (2026a, November 5). Industrial producer prices up by 2.5% in the euro area and by 2.6% in the EU (Euro indicators, September 2026). https://ec.europa.eu/eurostat/web/products-euro-indicators/w/4-05112026-ap
Eurostat. (2026b). Producer prices in industry, domestic market – monthly data (sts_inppd_m) (data set). Downloaded November 7, 2026, from https://ec.europa.eu/eurostat/databrowser/view/sts_inppd_m/default/table
Yılmaz, M. İ. (2026a, November 5). Bank of Japan, minutes of the 17–18 September 2026 meeting: A 7–2 vote to raise the policy rate to around 1.25%, with producer price inflation of 7–8% and exports picking up on AI-related demand. https://muhammedikbalyilmaz.com/posts/boj-minutes-september-2026.html
Yılmaz, M. İ. (2026b, November 4). Euro area flash inflation, October 2026: 4.0%, the highest since September 2023, as energy reaches 20.8% and core stays at 2.5%. https://muhammedikbalyilmaz.com/posts/euro-area-flash-inflation-october-2026.html
Notes
-
The monthly and annual rates for the total, the total excluding energy and the five main industrial groupings, the revision of August (monthly rate from 1.9% to 2.0%, annual rate from 8.2% to 8.3%), the date of the next release and the definitions are from the Eurostat release, tables and notes for users (Eurostat, 2026a). The euro area is EA21, including Bulgaria. The index shows changes in the ex-works sale prices of all products sold on the domestic market, excluding imports; total industry covers NACE Rev. 2 sections B to D and E36. All September 2026 figures are first estimates. ↑
-
Eurostat database, dataset sts_inppd_m, euro area EA21, not adjusted, index 2021 = 100 and rates of change on the previous month and on the same month of the previous year, total industry, total excluding energy, the main industrial groupings and the NACE divisions C19 and D35 (and section B), January 2015 – September 2026, downloaded 7 November 2026 (Eurostat, 2026b): data (CSV). The database gives the same values as the release for the total, the total excluding energy and the five main groupings. The HICP rates for September 2026 are from the data file of the note on euro area flash inflation (Yılmaz, 2026b; Eurostat database, prc_hicp_minr). "Highest since" comparisons use the published one-decimal rates. The workbook lists every number in the note next to the formula that produces it and a check against the text, so that readers who wish to examine the calculations can follow and audit them in a spreadsheet without losing time and without running any code. The code that draws the figure and repeats the same calculations is available on request. ↑
-
Calculations (author's). Base effect, with $\pi$ the annual and $m$ the monthly rate: $$1+\pi_t = \frac{(1+\pi_{t-1})(1+m_t)}{1+m_{t-12}}$$ Total industry, published $11.1$: $$\left(\frac{1.083 \times 1.025}{0.999} - 1\right) \times 100 = 11.12$$ Energy, published $30.8$: $$\left(\frac{1.210 \times 1.078}{0.998} - 1\right) \times 100 = 30.70$$ Total excluding energy, published $3.5$: $$\left(\frac{1.034 \times 1.001}{1.000} - 1\right) \times 100 = 3.50$$ Statistics over the 141 monthly annual rates from January 2015 to September 2026, the current month included: total industry, median $0.6$, first and third quartiles $-2.5$ and $4.4$ (Excel QUARTILE.INC, linear interpolation between ordered values), mean $3.6$, and $120$ of the other $140$ values are below $11.1$; energy, median $-0.7$, quartiles $-8.5$ and $10.3$, and $124$ of the other $140$ values are below $30.8$. "Highest since February 2023": every monthly annual rate from March 2023 to August 2026 is below $11.1$. Energy: every annual rate from January 2023 to August 2026 is below $30.8$, and every monthly rate from April to August 2026 is below $7.8$. ↑