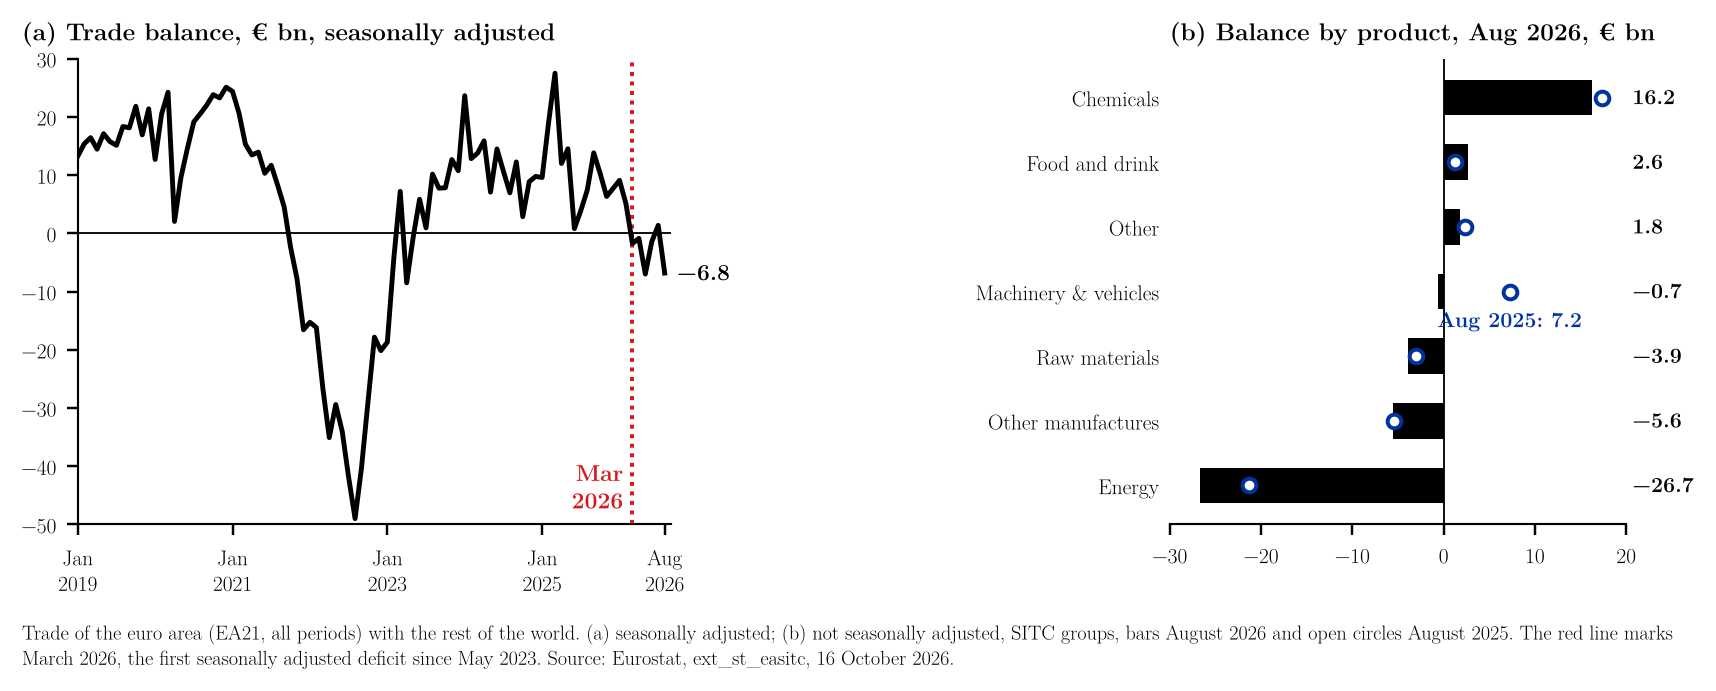
Eurostat's first estimate, published on 16 October 2026, shows a euro area deficit of €16.1 bn in trade in goods with the rest of the world in August 2026, against a deficit of €1.7 bn in August 2025 (Eurostat, 2026a).1 Exports rose 9.9% on the year to €227.7 bn, but imports rose 16.7% to €243.8 bn (Eurostat, 2026a, 2026b; note 3). Of the €14.4 bn deterioration, €7.9 bn came from machinery and vehicles, whose balance went from a €7.2 bn surplus to a €0.7 bn deficit, and €5.4 bn from energy, whose deficit widened from €21.3 bn to €26.7 bn (Eurostat, 2026b; Figure 1b; note 3). The year-on-year comparison uses unadjusted data: unadjusted exports were lower in August than in July in every year since 2019 (Eurostat, 2026b), and comparing the same month of two years removes most of that seasonal pattern, while the change on July needs the seasonally adjusted series. Seasonally adjusted, exports fell 1.2% and imports rose 2.0% in August, and the balance moved from a €1.4 bn surplus in July to a €6.8 bn deficit (Eurostat, 2026a, 2026b; note 3). March 2026 was the first seasonally adjusted deficit since May 2023, and five of the first eight months of 2026 have been in deficit (Eurostat, 2026b; Figure 1a; note 3). In June–August, seasonally adjusted exports were 2.5% and imports 2.1% higher than in March–May (Eurostat, 2026b; note 3). From January to August 2026 the unadjusted balance was a deficit of €5.4 bn, against a surplus of €90.9 bn in the same period of 2025, as exports rose 2.1% and imports 7.3% (Eurostat, 2026a, 2026b; note 3). The calculations are in note 3.23
References
Eurostat. (2026a, October 16). Euro area international trade in goods deficit €16.1 bn (Euro indicators). https://ec.europa.eu/eurostat/web/products-euro-indicators/w/6-16102026-bp
Eurostat. (2026b). Euro area trade by SITC product group (ext_st_easitc) (data set). Downloaded October 16, 2026, from https://ec.europa.eu/eurostat/databrowser/view/ext_st_easitc/default/table
Notes
-
The August 2026 and August 2025 balances, exports and imports and their annual changes are from the Eurostat release of 16 October 2026, whose figures are provisional (Eurostat, 2026a). The release lists its source dataset as ext_st_ea_sitc; in the Eurostat API the same data are published as ext_st_easitc (Eurostat, 2026b). ↑
-
Eurostat database, dataset ext_st_easitc, euro area (EA21) trade with partners outside the euro area, million euro; exports, imports and balance, not seasonally adjusted (TRD_VAL) and seasonally adjusted (TRD_VAL_SCA), January 2019 – August 2026, and the balance by one-digit SITC group, downloaded 16 October 2026 (Eurostat, 2026b): data (CSV) and product groups (CSV). The SITC groups are 0+1 (food and drink), 2+4 (raw materials), 3 (energy), 5 (chemicals), 7 (machinery and vehicles), 6+8 (other manufactured goods) and 9 (other). Eurostat adjusts the series with TRAMO-SEATS in JDemetra+ and derives the euro area aggregates indirectly, from member states' adjusted series. The workbook lists every number in the note next to the formula that produces it and a check against the text, so that readers who wish to examine the calculations can follow and audit them in a spreadsheet without losing time and without running any code. The code that draws the figure and repeats the same calculations is available on request. ↑
-
Calculations. The balance is exports minus imports, $B_t = X_t - M_t$, in million euro. August 2026: $$B = 227{,}681.4 - 243{,}790.9 = -16{,}109.5$$ Year-on-year changes, $(X_t/X_{t-12} - 1)\times 100$. Exports: $$\left(\frac{227{,}681.4}{207{,}209.7} - 1\right)\times 100 = 9.88$$ Imports: $$\left(\frac{243{,}790.9}{208{,}925.5} - 1\right)\times 100 = 16.69$$ Change in the balance: $$-16{,}109.5 - (-1{,}715.8) = -14{,}393.7$$ It is the sum of the changes by product group. Machinery and vehicles: $$-664.8 - 7{,}229.7 = -7{,}894.5$$ Energy: $$-26{,}696.3 - (-21{,}314.5) = -5{,}381.8$$ The other groups are chemicals $-1{,}071.5$, raw materials $-862.6$, other $-490.5$, other manufactured goods $-131.1$ and food and drink $+1{,}438.4$. The seven groups add up to the total in August 2026 exactly and in August 2025 up to rounding ($-1{,}715.9$ against $-1{,}715.8$). Seasonally adjusted change on the previous month, exports and imports: $$\left(\frac{257{,}201.0}{260{,}339.8} - 1\right)\times 100 = -1.21, \qquad \left(\frac{264{,}027.6}{258{,}973.2} - 1\right)\times 100 = 1.95$$ Three months against the previous three, exports and imports: $$\left(\frac{775{,}584.3}{756{,}998.8} - 1\right)\times 100 = 2.46, \qquad \left(\frac{782{,}495.2}{766{,}641.3} - 1\right)\times 100 = 2.07$$ January–August balance, 2026: $$1{,}990{,}770.4 - 1{,}996{,}155.6 = -5{,}385.2$$ 2025: $$1{,}950{,}658.2 - 1{,}859{,}833.5 = 90{,}824.7$$ This rounds to €90.8 bn. The release's €90.9 bn equals the difference of its rounded totals: $$1{,}950.7 - 1{,}859.8 = 90.9$$ January–August growth, exports and imports: $$\left(\frac{1{,}990{,}770.4}{1{,}950{,}658.2} - 1\right)\times 100 = 2.06, \qquad \left(\frac{1{,}996{,}155.6}{1{,}859{,}833.5} - 1\right)\times 100 = 7.33$$ Seasonally adjusted balances below zero since 2023: January, February, April and May 2023, then March, April, May, June and August 2026. ↑