The U.S. Bureau of Labor Statistics (BLS) reported on 10 November that the consumer price index for all urban consumers rose 0.4% in October 2026 on a seasonally adjusted basis, after 0.6% in September; the index excluding food and energy rose 0.3%, as in September and August (BLS, 2026a).1 The release contains no twelve-month rate for all items or for the core. BLS did not collect prices for October 2025 because of a lapse in appropriations, published no index for that month, and so cannot publish twelve-month changes where the October 2025 index is missing (BLS, 2026a). The same lapse left the household survey of the October employment report without a year-earlier figure (Yılmaz, 2026b).
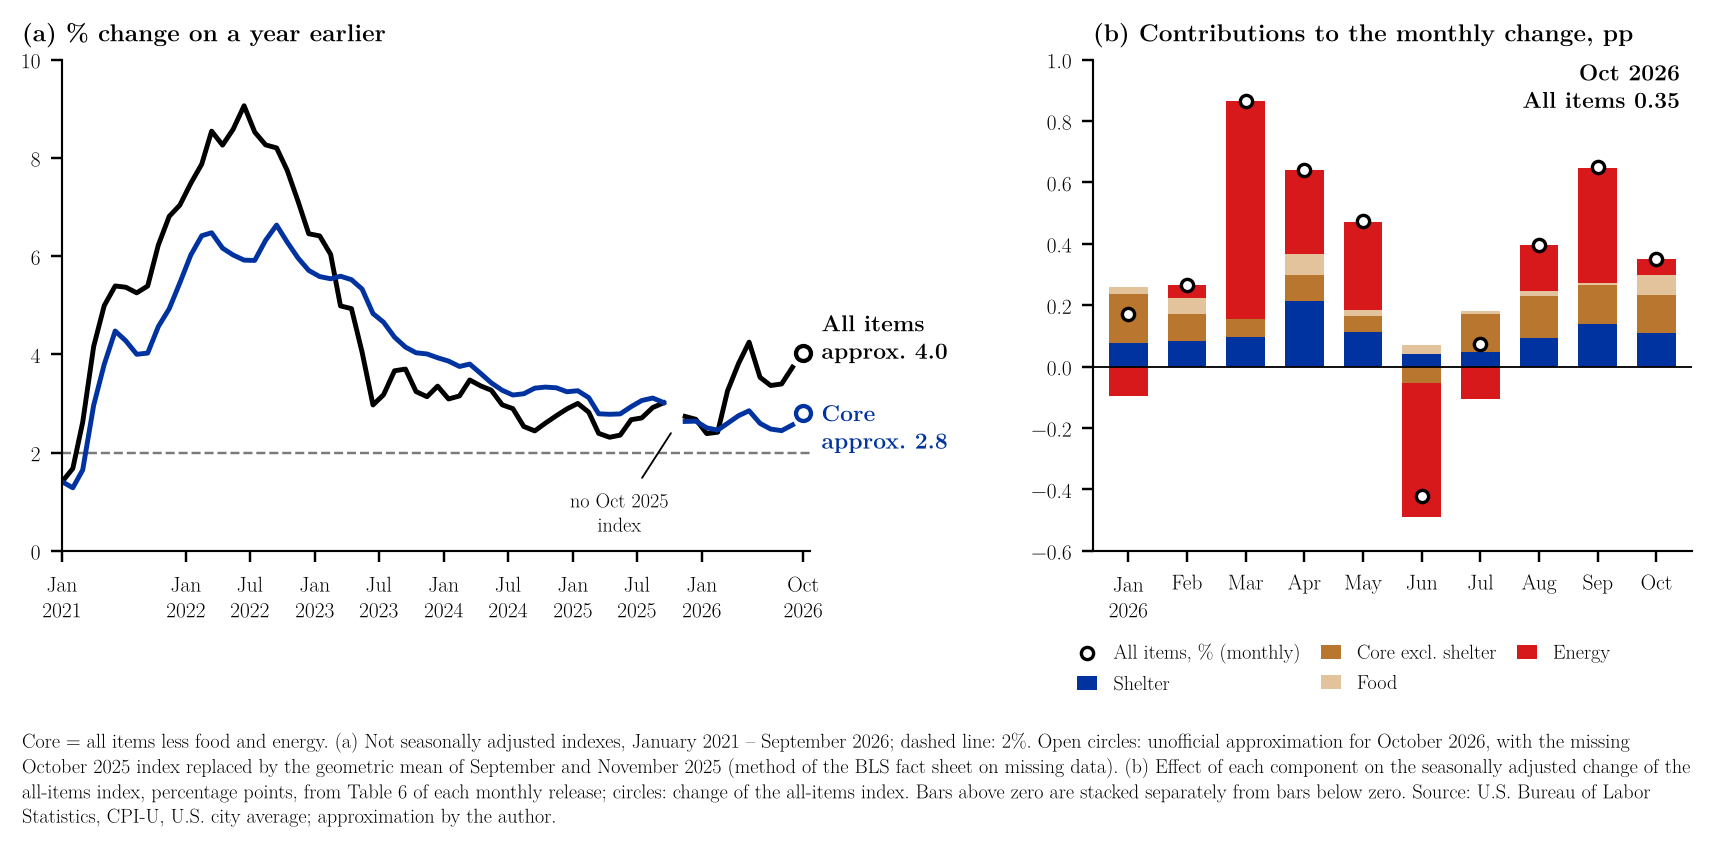
A BLS fact sheet describes how a missing index can be approximated: by the geometric mean of the neighbouring months, with the warning that the result is not an official CPI series (BLS, 2025). Applied to October 2025, it gives 324.461 for all items and a twelve-month change of about 4.0% in October 2026, after the 3.7% of the September note (Yılmaz, 2026a); for the core, 330.614 and about 2.8%, after 2.6% (Figure 1a). Two figures need no approximation: prices rose 3.9% in the thirteen months from September 2025 and 4.1% in the eleven months from November 2025, which are 3.6% and 4.5% at an annual rate.2
In the 77 months from February 2020 to September 2026 with all three indexes published, the approximation misses the all-items index by 0.14% on average (median 0.10%, largest 0.69%), and the core index by 0.08%. In every October from 2020 to 2024 it fell short, by 0.05% to 0.25%; a shortfall of that size in October 2025 would put the rate between 3.8% and 4.0%. This is the author's check, not a BLS estimate.3
The monthly change does not depend on the missing month. In September BLS attributed over half of the increase to gasoline (Yılmaz, 2026a). In Table 6 of the release, which gives each component's effect on the seasonally adjusted all-items change, energy, up 0.7% after 5.2%, accounts for 0.05 of October's 0.35 points, against 0.38 of September's 0.65 (BLS, 2026c). Shelter, up 0.3%, accounts for 0.11 (31%; the release says over thirty percent), food, up 0.5%, for 0.06 and the rest of the core for 0.13, the same as in September (Figure 1b). The Technical Note gives a standard error of 0.04% for the one-month change, so that 95% of estimates fall within 0.08% (BLS, 2026a): from 0.27% to 0.43%.
For the November figure, due on 10 December, the twelve-month comparison has a base: BLS has an index for November 2025.
References
U.S. Bureau of Labor Statistics. (2025, December 17). Approximating missing data points (fact sheet). https://www.bls.gov/cpi/factsheets/approximating-missing-data.htm
U.S. Bureau of Labor Statistics. (2026a, November 10). Consumer price index – October 2026 (USDL-26-1685). https://www.bls.gov/news.release/archives/cpi_11102026.htm
U.S. Bureau of Labor Statistics. (2026b). Consumer price index for all urban consumers, series CUUR0000SA0, CUUR0000SA0L1E, CUSR0000SA0 and CUSR0000SA0L1E (data set). Downloaded November 10, 2026, from https://data.bls.gov/timeseries/CUUR0000SA0
U.S. Bureau of Labor Statistics. (2026c). Consumer price index, monthly news releases for January to October 2026, Table 6 (seasonally adjusted effect of each component on all items). Retrieved November 10, 2026, from https://www.bls.gov/bls/news-release/cpi.htm
Yılmaz, M. İ. (2026a, October 14). US consumer prices, September 2026: Headline 3.7%, core 2.6%. https://muhammedikbalyilmaz.com/posts/us-cpi-september-2026.html
Yılmaz, M. İ. (2026b, November 7). US Employment Situation, October 2026: Payrolls up 165,000 (90% interval of the monthly change, 43,000 to 287,000), unemployment rate 4.1%, and August and September revised up by 84,000. https://muhammedikbalyilmaz.com/posts/us-employment-situation-october-2026.html
Notes
-
The monthly changes of all items, the core, shelter, food and energy, the statement on shelter's share of the increase, the explanation of the missing twelve-month changes, and the standard error are from the text, Table A and the Technical Note of the release (BLS, 2026a). Among the few twelve-month changes the release does publish are gasoline (37.4%), new vehicles (0.7%) and used cars and trucks (−3.3%). The reference is to the archived copy of the release, whose address does not change. The date of the fact sheet is its "last modified" date. ↑
-
BLS Public Data API (BLS, 2026b), not seasonally adjusted indexes for the twelve-month comparisons and seasonally adjusted indexes for the monthly changes, index 1982–84 = 100, January 2020 – October 2026, downloaded 10 November 2026; the values up to September 2026 are the same as in the file of the September note: data (CSV). Effects of food, energy, the core and shelter on the all-items change, January – October 2026, copied from Table 6 of each monthly release, whose address is given in the file (BLS, 2026c): effects (CSV). The workbook lists every number in the note next to the formula that produces it and a check against the text, so that readers who wish to examine the calculations can follow and audit them in a spreadsheet without losing time and without running any code. The code that draws the figure and repeats the same calculations is available on request. ↑
-
Calculations (author's, unofficial). $P_t$ is the not seasonally adjusted index. Following the fact sheet (BLS, 2025), the October 2025 index is the geometric mean of the two months around it: $$\hat P_{\text{Oct 2025}} = \sqrt{P_{\text{Sep 2025}}\, P_{\text{Nov 2025}}} = \sqrt{324.800 \times 324.122} = 324.461$$ Annual rate, all items: $$\left(\frac{337.511}{324.461} - 1\right)\times 100 = 4.02$$ Core: $$\sqrt{330.804 \times 330.425} = 330.614, \qquad \left(\frac{339.921}{330.614} - 1\right)\times 100 = 2.81$$ Thirteen months, and the same at an annual rate: $$\left(\frac{337.511}{324.800} - 1\right)\times 100 = 3.91, \qquad \left(\frac{337.511}{324.800}\right)^{12/13} - 1 = 3.61\%$$ Eleven months: $$\left(\frac{337.511}{324.122} - 1\right)\times 100 = 4.13, \qquad \left(\frac{337.511}{324.122}\right)^{12/11} - 1 = 4.51\%$$ Back-test. For each month $t$ with $P_{t-1}$, $P_t$ and $P_{t+1}$ published, the error is $$\varepsilon_t = \left(\frac{\sqrt{P_{t-1} P_{t+1}}}{P_t} - 1\right)\times 100$$ The 77 months exclude September, October and November 2025. If the error for October 2025 was $\varepsilon$, the rate is $$\left(\frac{337.511\,(1 + \varepsilon/100)}{324.461} - 1\right)\times 100$$ This gives 3.97 for the smallest October shortfall ($\varepsilon = -0.05$) and 3.76 for the largest ($\varepsilon = -0.25$). Effects on the monthly change. The figures are those of Table 6 and are not computed by the author. The rest of the core is the effect of all items less food and energy minus that of shelter, in October: $$0.234 - 0.108 = 0.126$$ Food, energy and the core add up to the all-items change computed from the seasonally adjusted index within 0.01 point in each month from January to October 2026. ↑