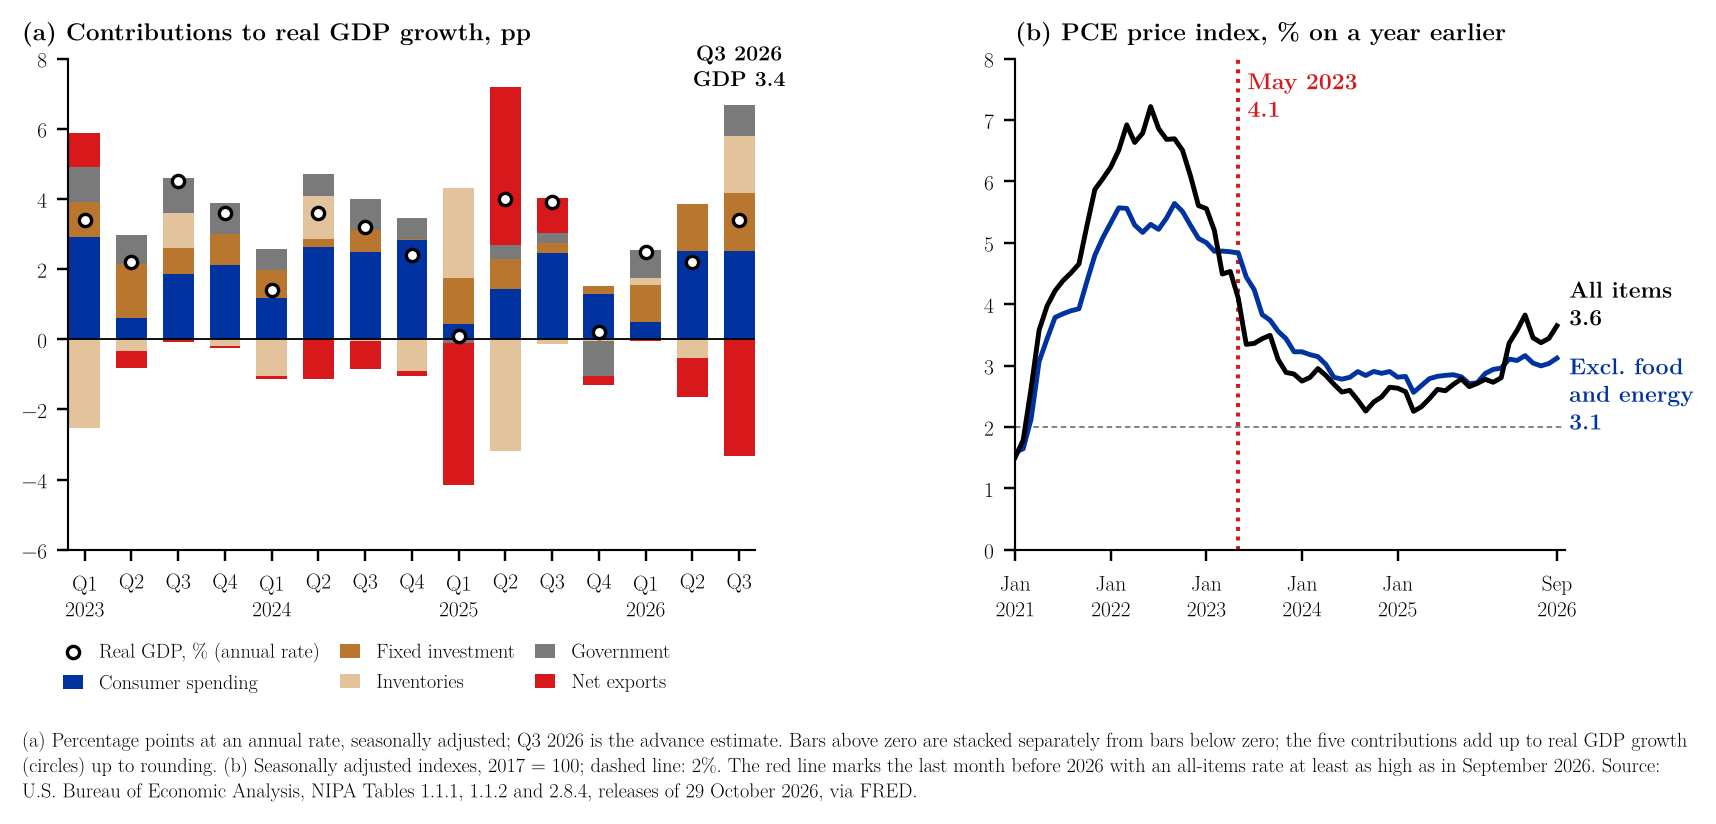
The U.S. Bureau of Economic Analysis (BEA) reported on 29 October that real gross domestic product grew at a seasonally adjusted annual rate of 3.4% in the third quarter of 2026, after 2.2% in the second (BEA, 2026a).1 Consumer spending contributed 2.52 percentage points, fixed investment 1.66, inventories 1.61 and government 0.90, while net exports subtracted 3.32 points, the largest negative contribution since the first quarter of 2025 (−4.04) (Figure 1a). Real final sales to private domestic purchasers, which leave out inventories, net exports and government, grew 4.9%. Placed against the whole published series, the third-quarter rate is not unusual: of the 318 quarterly rates from the second quarter of 1947 to the third quarter of 2026, 147 (46.2%) were 3.4% or higher, and the median is 3.1%. Measured from 2000 the median is lower, 2.5%, and 35 of 107 quarters (32.7%) reached 3.4%. The comparison mixes a first estimate with older quarters that have been revised many times, so it describes the published numbers rather than a settled ranking (BEA, 2026a, 2026c).2
The second release reports monthly prices. The PCE price index rose 0.5% in September and 3.6% over twelve months; excluding food and energy it rose 0.3% and 3.1% (Figure 1b). Apart from May 2026 (3.8%), the last month with a twelve-month rate at least as high as September's was May 2023 (4.1%); for the index excluding food and energy, apart from May 2026 (3.2%), it was March 2024 (3.1%). The GDP release shows a much lower figure for the same prices, 2.1% for the third quarter, and the two are consistent. The quarterly rate compares the average level of the three months of the third quarter with that of the second, and the index fell 0.1% in June and rose only 0.1% in July, so the third-quarter average was 0.52% above the second-quarter average (2.1% at an annual rate), while the September level was 0.88% above the June level and 3.6% above that of September 2025. Real consumer spending was unchanged in September (an increase of less than 0.1%), real disposable income fell 0.3%, and the saving rate was 3.8%. This note only summarises the published figures and the arithmetic that links them; it does not test what caused the changes (BEA, 2026b, 2026d).34
References
U.S. Bureau of Economic Analysis. (2026a, October 29). Gross domestic product (advance estimate), 3rd quarter 2026. https://www.bea.gov/news/2026/gdp-advance-estimate-3rd-quarter-2026
U.S. Bureau of Economic Analysis. (2026b, October 29). Personal income and outlays, September 2026 (News release No. BEA 26-46). https://www.bea.gov/news/2026/personal-income-and-outlays-september-2026
U.S. Bureau of Economic Analysis. (2026c). Real gross domestic product, percent change from preceding period (series A191RL1Q225SBEA), and contributions to percent change in real GDP (series DPCERY2Q224SBEA, A007RY2Q224SBEA, A014RY2Q224SBEA, A019RY2Q224SBEA and A822RY2Q224SBEA) (data set). Retrieved October 31, 2026, from FRED, Federal Reserve Bank of St. Louis.
U.S. Bureau of Economic Analysis. (2026d). PCE price index and PCE price index excluding food and energy (series PCEPI and PCEPILFE) (data set). Retrieved October 31, 2026, from FRED, Federal Reserve Bank of St. Louis.
Notes
-
The growth rates, contributions and real final sales to private domestic purchasers are from the GDP release (BEA, 2026a); consumer spending, disposable income, the saving rate and the PCE price rates are from the Personal Income and Outlays release (BEA, 2026b). The second estimate for the third quarter is scheduled for 25 November 2026. ↑
-
BEA (2026c), NIPA Table 1.1.1 (real GDP, percent change from preceding period at an annual rate, FRED series A191RL1Q225SBEA, second quarter of 1947 – third quarter of 2026) and Table 1.1.2 (contributions to percent change in real GDP: personal consumption expenditures, fixed investment, change in private inventories, net exports of goods and services, government consumption expenditures and gross investment; FRED series DPCERY2Q224SBEA, A007RY2Q224SBEA, A014RY2Q224SBEA, A019RY2Q224SBEA, A822RY2Q224SBEA, first quarter of 2019 – third quarter of 2026), retrieved from FRED, Federal Reserve Bank of St. Louis, 31 October 2026 (series updated 29 October 2026): growth rates (CSV), contributions (CSV). In every quarter of the contributions file the five contributions add up to the published growth rate within 0.05 points. Real final sales to private domestic purchasers is quoted from the release. ↑
-
BEA (2026d), NIPA Table 2.8.4, PCE price index and PCE price index excluding food and energy, 2017 = 100, seasonally adjusted, January 2020 – September 2026 (FRED series PCEPI and PCEPILFE), retrieved from FRED, 31 October 2026: data (CSV). The indexes reproduce the four rates in the release (0.5%, 3.6%, 0.3%, 3.1%) and the third-quarter rates in the GDP release (2.1%, and 2.5% excluding food and energy). Real consumer spending, real disposable income and the saving rate are quoted from the release. The workbook lists every number in the note next to the formula that produces it and a check against the text, so that readers who wish to examine the calculations can follow and audit them in a spreadsheet without losing time and without running any code. The code that draws the figure and repeats the same calculations is available on request. ↑
-
Calculations. With $g_t$ the published quarterly growth rate, the share is $\#\{t : g_t \ge 3.4\}/T$ over $T = 318$ quarters (1947Q2–2026Q3, including 2026Q3; seven quarters equal 3.4) and $T = 107$ quarters (2000Q1–2026Q3). With $P_t$ the monthly index, the twelve-month rate is $(P_t/P_{t-12} - 1)\times 100$. September 2026, all items and excluding food and energy: $$\left(\frac{132.257}{127.601} - 1\right)\times 100 = 3.65, \qquad \left(\frac{130.902}{126.940} - 1\right)\times 100 = 3.12$$ The quarterly rate at an annual rate, where $\bar P$ is the average of the three monthly indexes: $$\pi^{q} = \left[\left(\frac{\bar P_{Q3}}{\bar P_{Q2}}\right)^{4} - 1\right]\times 100$$ All items: $$\bar P_{Q3} = 131.685, \qquad \bar P_{Q2} = 131.006$$ $$\frac{\bar P_{Q3}}{\bar P_{Q2}} - 1 = 0.52\%, \qquad \pi^{q} = 2.09$$ Excluding food and energy: $$\bar P_{Q3} = 130.513, \qquad \bar P_{Q2} = 129.720, \qquad \pi^{q} = 2.47$$ September against June: $$\left(\frac{132.257}{131.106} - 1\right)\times 100 = 0.88$$ The comparisons are descriptive; no test of the effect of one component on another, or of any other variable, has been made. ↑