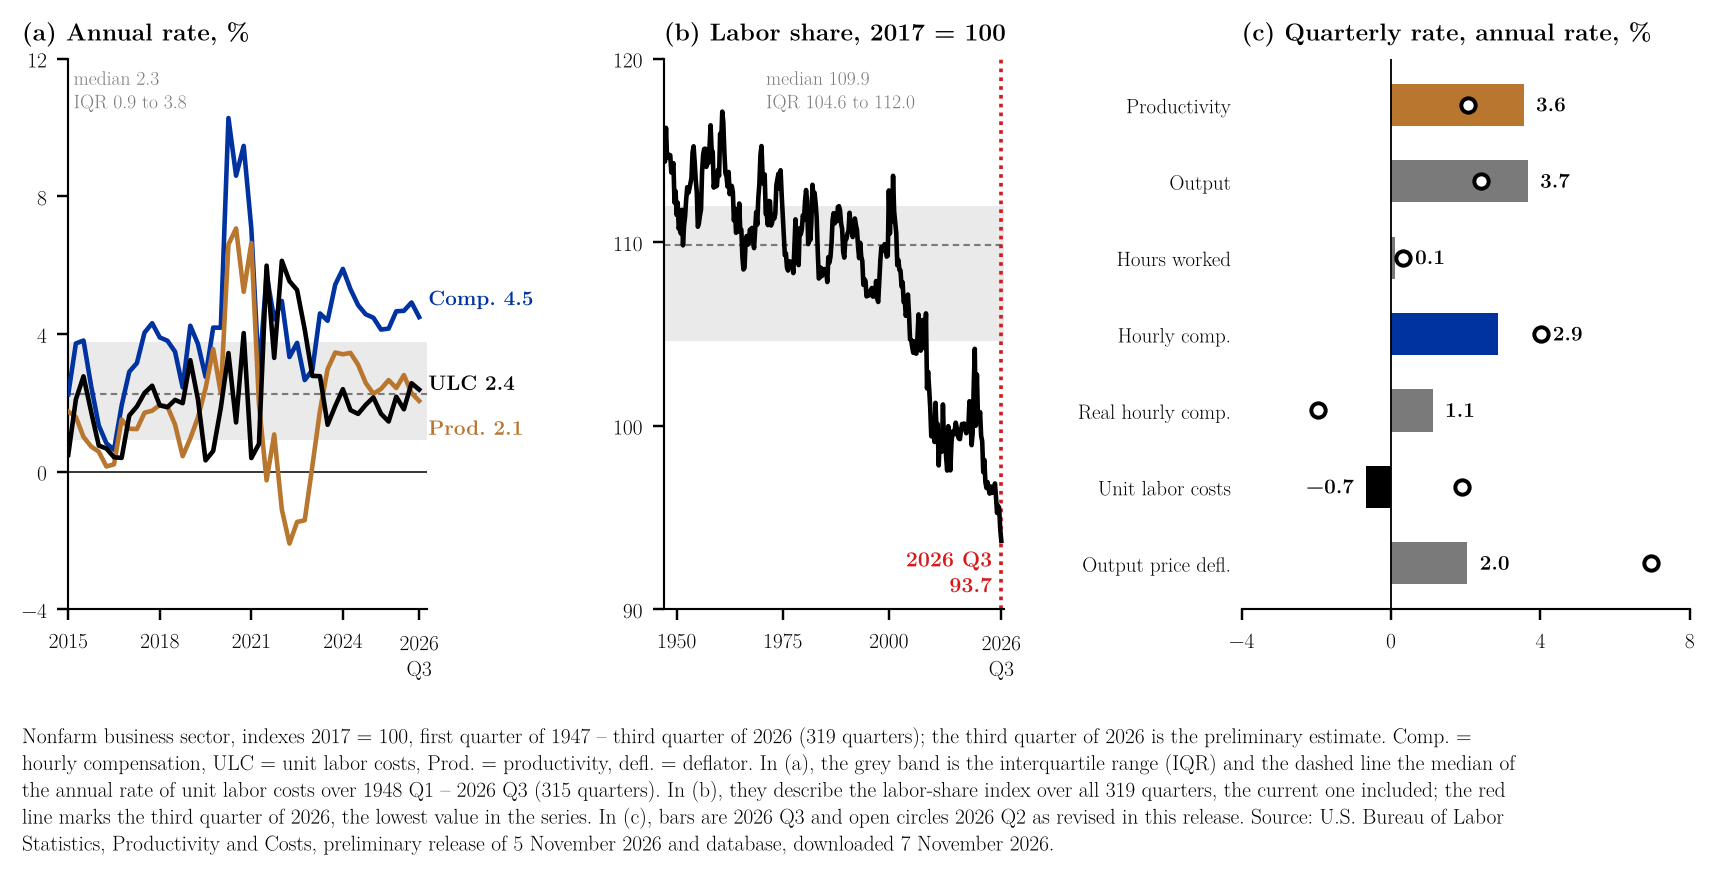
The U.S. Bureau of Labor Statistics (BLS) reported on 5 November that nonfarm business sector labor productivity rose at a seasonally adjusted annual rate of 3.6% in the third quarter of 2026, as output rose 3.7% and hours worked 0.1% (U.S. Bureau of Labor Statistics, 2026a).1 Productivity was 2.1% higher than a year earlier. Hourly compensation rose 2.9% (4.5% on the year) and real hourly compensation 1.1% (1.0%), so unit labor costs fell 0.7% on the quarter and were 2.4% higher on the year. The second quarter was revised up, productivity from 1.4% to 2.1% and unit labor costs from 1.2% to 1.9%, after the annual update of the national accounts. Real GDP grew 3.4% in the same quarter, in the note on the BEA release (Yılmaz, 2026).
The rates are tied by an identity: unit labor costs are hourly compensation divided by productivity, so $(1.029/1.036 - 1) \times 100 = -0.7$ for the quarter and, with the annual rates, $(1.045/1.021 - 1) \times 100 = 2.4$ (published 2.4). The third-quarter gain in productivity comes from output, as hours were nearly unchanged (Figure 1c).2
Against the published series, the annual rates are close to their usual levels. Over 1948 Q1 – 2026 Q3 (315 quarters) the median annual rate of productivity is 2.1% (interquartile range 1.0% to 3.4%), the same as the latest annual rate; unit labor costs, 2.4%, compare with a median of 2.3% (0.9% to 3.8%), and hourly compensation, 4.5%, with 4.6% (3.3% to 6.3%). The means (2.2%, 2.7% and 4.9%) are above the medians. Annual rates in consecutive quarters share three of their four quarters, so these observations are not independent; the comparisons describe where a rate stands in the published series and are not probabilities. Measured from 2000, the median for hourly compensation is lower, 3.7%, and 4.5% is above 78 of the other 106 quarters. A single quarter is noisier: 98 of the 318 quarterly rates of productivity since 1947 Q2 (30.8%) were 3.6% or higher, and the median is 1.9%; from 2000, 29 of 107 (27.1%), with a median of 2.0% (Figure 1a).3
The release also gives the labor share, the percentage of output that accrues to workers as compensation: 53.0% in the third quarter, the lowest in the series (U.S. Bureau of Labor Statistics, 2026a). On the BLS index (2017 = 100) it is 93.7, against a median of 109.9 (interquartile range 104.6 to 112.0) over the 319 quarters. The next lowest values are 94.4 in the second quarter of 2026 and 95.3 in the third quarter of 2025 (Figure 1b). The labor share equals unit labor costs divided by the output price deflator, so it falls when output prices rise faster than unit labor costs: 2.0% against −0.7% in the third quarter (7.0% against 1.9% in the second), and 4.1% against 2.4% on the year. This is accounting, not a test of what moved the share. In manufacturing, productivity rose 0.3% on the quarter (0.4% on the year) and unit labor costs 2.7% (4.0%) (U.S. Bureau of Labor Statistics, 2026a).
These are preliminary estimates, and the revised release is scheduled for 8 December. The second-quarter revision, 0.7 points for productivity, shows how far a first estimate can move; this note adds no error band to the figures.
References
U.S. Bureau of Labor Statistics. (2026a, November 5). Productivity and costs, third quarter 2026, preliminary (USDL-26-1631). https://www.bls.gov/news.release/archives/prod2_11052026.htm
U.S. Bureau of Labor Statistics. (2026b). Productivity and costs, nonfarm business sector (data set). Downloaded November 7, 2026, from https://data.bls.gov/timeseries/PRS85006093
Yılmaz, M. İ. (2026, October 31). US GDP, third quarter of 2026: Growth of 3.4% with net exports subtracting 3.3 points; PCE prices up 3.6% on a year earlier. https://muhammedikbalyilmaz.com/posts/us-gdp-pce-q3-2026.html
Notes
-
The quarterly and annual rates of productivity, output, hours, hourly compensation, real hourly compensation and unit labor costs, the revisions of the second quarter (productivity up 0.7 points, unit labor costs up 0.7 points), the manufacturing figures, the labor share of 53.0%, the definition of unit labor costs as the ratio of hourly compensation to productivity, the annual update of the national accounts and the date of the revised release are from the BLS release (U.S. Bureau of Labor Statistics, 2026a). The sector is the nonfarm business sector. All third-quarter 2026 figures are preliminary. ↑
-
BLS database, Productivity and Costs, nonfarm business sector, seasonally adjusted indexes (2017 = 100) of labor productivity (series PRS85006093), hourly compensation (PRS85006103), unit labor costs (PRS85006113), real output (PRS85006043), hours worked (PRS85006033), implicit price deflator (PRS85006143), labor share (PRS85006173) and real hourly compensation (PRS85006153), first quarter of 1947 – third quarter of 2026, downloaded 7 November 2026 (U.S. Bureau of Labor Statistics, 2026b): data (CSV). The rates computed from the indexes reproduce the release at one decimal. The workbook lists every number in the note next to the formula that produces it and a check against the text, so that readers who wish to examine the calculations can follow and audit them in a spreadsheet without losing time and without running any code. The code that draws the figure and repeats the same calculations is available on request. ↑
-
Calculations (author's). With $X_t$ the index, the quarterly rate at an annual rate and the annual rate: $$\left[\left(\frac{X_t}{X_{t-1}}\right)^4 - 1\right] \times 100, \qquad \left(\frac{X_t}{X_{t-4}} - 1\right) \times 100$$ Identity: unit labor costs $= $ hourly compensation $/$ productivity, so $1 + u = (1 + c)/(1 + p)$. From the indexes, on the year: $$\frac{151.663/145.141}{121.922/119.464} - 1 = 2.39\%$$ Labor share $=$ unit labor costs $/$ output price deflator, so $1 + s = (1 + u)/(1 + d)$. On the year: $$\left(\frac{1.024}{1.041} - 1\right) \times 100 = -1.6$$ Statistics over the annual rates of 1948 Q1 – 2026 Q3 (315 quarters, the current one included), Excel QUARTILE.INC: productivity, median $2.1$, quartiles $1.0$ and $3.4$, mean $2.2$; unit labor costs, median $2.3$, quartiles $0.9$ and $3.8$, mean $2.7$; hourly compensation, median $4.6$, quartiles $3.3$ and $6.3$, mean $4.9$; from 2000 Q1 (107 quarters) hourly compensation has a median of $3.7$ and 4.5 is above $78$ of the other $106$ values. Quarterly rates of productivity: $98$ of $318$ from 1947 Q2 and $29$ of $107$ from 2000 Q1 are at least $3.6$ (rates rounded to one decimal), with medians $1.9$ and $2.0$. Labor share index, 319 quarters: median $109.9$, quartiles $104.6$ and $112.0$, minimum $93.7$ in 2026 Q3. Computed rates can differ from the BLS rates, which use unrounded data, by a tenth. The comparisons are descriptive; no test of the effect of one component on another has been made. ↑